Tutorial InnoRace®: The competition of projects
In a work environment that is changing ever faster you need tools that support this race.
The InnoRace® creates the opportunity to playfully visualise transparency about the progress of a large number of projects while at the same time raise motivation of an entire team.
1. Setup of the racetrack

![]()
Racing cars
DIY racing cars represent the individual projects that are driven by the project managers or teams

![]()
Racetrack
"Progress bar" for the completion of projects

![]()
Checkpoints
Defined tasks for completion of a project
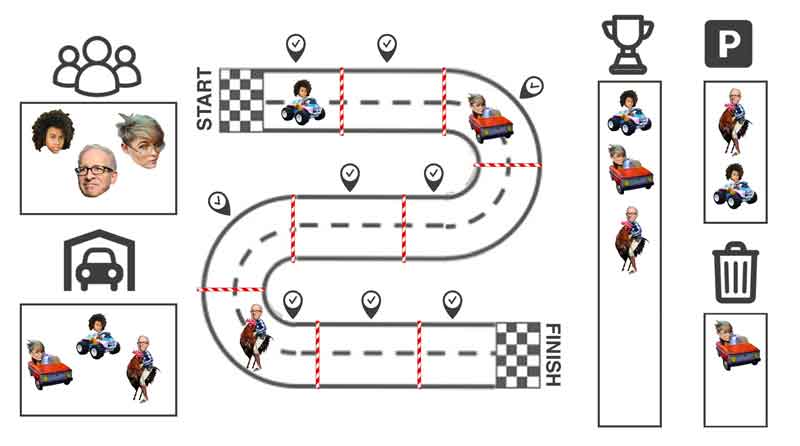
![]()
Finisher
List of all completed projects
![]()
Paddock
Overview of the drivers
![]()
Idea garage
List of not yet implemented ideas
![]()
Parking lot
List of all postponed ideas
![]()
Junkyard
List of all rejected ideas
![]()
Rules and standards
Displayed visible to everyone
2. What are the elements of the InnoRace®?
The racetrack on a highly visible spot in the office is the center of the game structure. This racetrack is sticked on a wall using the templates (see „Create your own InnoRace®“) or with a colorful adhesive tape.
In the pro version, the track with all components and racing cars will be available online. It can than been displayed simultaneously on a central screen (digital signage) and / or on several screens (desktop pc / notebooks).
The racetrack is divided into several sections, called checkpoints. These checkpoints represent the typical phases of a project.
On the racetrack are many racing cars. These racing cars represent individual projects. Each racing car has a driver. For more complex topics, it could be also several drivers. The driver/s are responsible for their respective projects. All racing cars could be designed individually by the drivers themselves - according to certain specifications - or just take one of the printables (Go to racing cars).
The racing cars “drive" after completion of each checkpoint to the next section. As soon as a vehicle passes the finish line, it gets its place on the wall of fame in the "finishers parking lot". Deferred ideas come to a "parking lot" and discarded ideas as a memorial on the "junkyard".
The idea garage is the place where new ideas are collected continuously.
In the paddock, little pictures are provided of each participant.
3. Why InnoRace®?
(Race leader= initiator / supervisor)
Transparency
- about the progress of each project.
- about the responsibility (person in charge) of the individual projects.
- overwiew of topics which are currently processed, are pending for the future, have ended, have been deferred and have been rejected. Completeness while processing due to determining of the order of the tasks (driving direction of the cars) and specification of the activities to be performed (checkpoints).
With the structured procedure, many projects can reliably be processed in parallel and deliver faster results.
It becomes visible which checkpoints is the bottleneck. Here is the chance to analyze the reasons and optimse the flow. This also contributes directly to the improvement of existing processes.
In particular, for inexperienced race leaders, the InnoRace® provides guidance about the sequence and the content of all necessary tasks.
Transparency of all upcoming tasks through the arrangement of the checkpoints. The tasks of all individual checkpoints are clearly defined.
The number of checkpoints and thus the workload is clear to the participants. Due to the clear setup of the race, the participants are not afraid of having enough knowledge to carry out a project. This is especially true for inexperienced participants.
Due to the individuel design of the racing cars an strong identification with ist „own“ project is granted.
The competitive nature of simulating a race creates an incentive and motivation to complete "his" / "her" / "their" project faster than the others.
Faster completion of projects by emphasizing the competitive nature of the race.
Increase team motivation as employees are included in the change processes rather than order changes from top to bottom
Increase the feeling in the team of actively participate in the continuous improvement of processes.
As a info base to inform people outside the project team(s) about the status of the projects. In addition, project-related hurdles can be shown virtually on the track.
4. How to start?
- Kick Off Meeting
- An official kick-off meeting will introduce the concept of InnoRace® to all participants.
- The rules and the playing field explained.
- The tasks to complete the individual checkpoints.
- Release of the racetrack
- In the free version is attached attached to the wall or published online in the pro version
- The official rules and standards are published visibly
- Distribution of tasks
- The projects are allocated to the individual drivers
The drivers design their own racing car and their labels individually. Or choose a printable (Go to racing cars)
Let the race begin!
5. What's next?
- In a recurring meeting the racers present their progress of the project to the race leader. The race leader can take corrective action and / or provide assistance for the checkpoints.
- As soon as a checkpoint has been mastered, the racing car will continue to the next checkpoint (= move the racing car oin the wall)
6. Use case: Continuous improvement process
![]()
Racing cars:
Represent the improvement projects, e.g. Optimize interface of departments
![]()
Checkpoints:
- Description of situation as is
This checkpoint describes the current situation of the process. The following question has to be clarified: how does the process / task works today and which weakness(es) does the process show. However, do not describe the target process. This description is the basis for the improvement project. (Here you can download a printable for describing the actual situation)
- Description of target situation
Here, the desired process, based on the contents of the description of the actual situation, is outlined roughly. The optimization of today's processes is the focus. (Here you can download a printable for describing the target situation)
- Gain calculation
Calculation of the expected efficiency gains and / or cost savings. Experience shows that support is needed at this point. (Here you can download a printable with an example and blank template for your improvement project)
- Presentation to responsible
The solution including the gains are discussed. Decision whether the solution fits into the overall concept / vision of the department.
- Creation of documentation
The agreed improved process will be described. It can be used text, diagrams, screenshots.
- Approval of responsible
Based on the documentation produced, the decision maker checks whether the process is sufficiently documented:
- Are all interfaces involved?
- Is a training plan created?
- Are deadlines set?
- etc.
Release by decision maker. (Here you can download a printable for the release decision of the decision maker.)
- Testing phase
The improved process is tested by the driver(s) in a test environment or a limited part for its resistance against reality and if necessary being improved again. The test phase is limited to a few days or weeks.
- Training
The driver presents the results (the future process) to all involved people, e.g. as a fixed TOP in a regular meeting. For complex topics, individual training makes sense.
- Integration in standard operation procedure
Include the improved process in the standard operation procedure or update the original process in standard operation procedure.
- Implement in day-to-day routine
Adopt the improved process throughout the team.If the new process is demonstrably lived in the team, the checkpoint is done.
The race car can pass the finish line and is placed on the wall of fame – the finisher parking lot.